Data visualisation components

(Description)

Challenges & Objectives

/ Project Overview

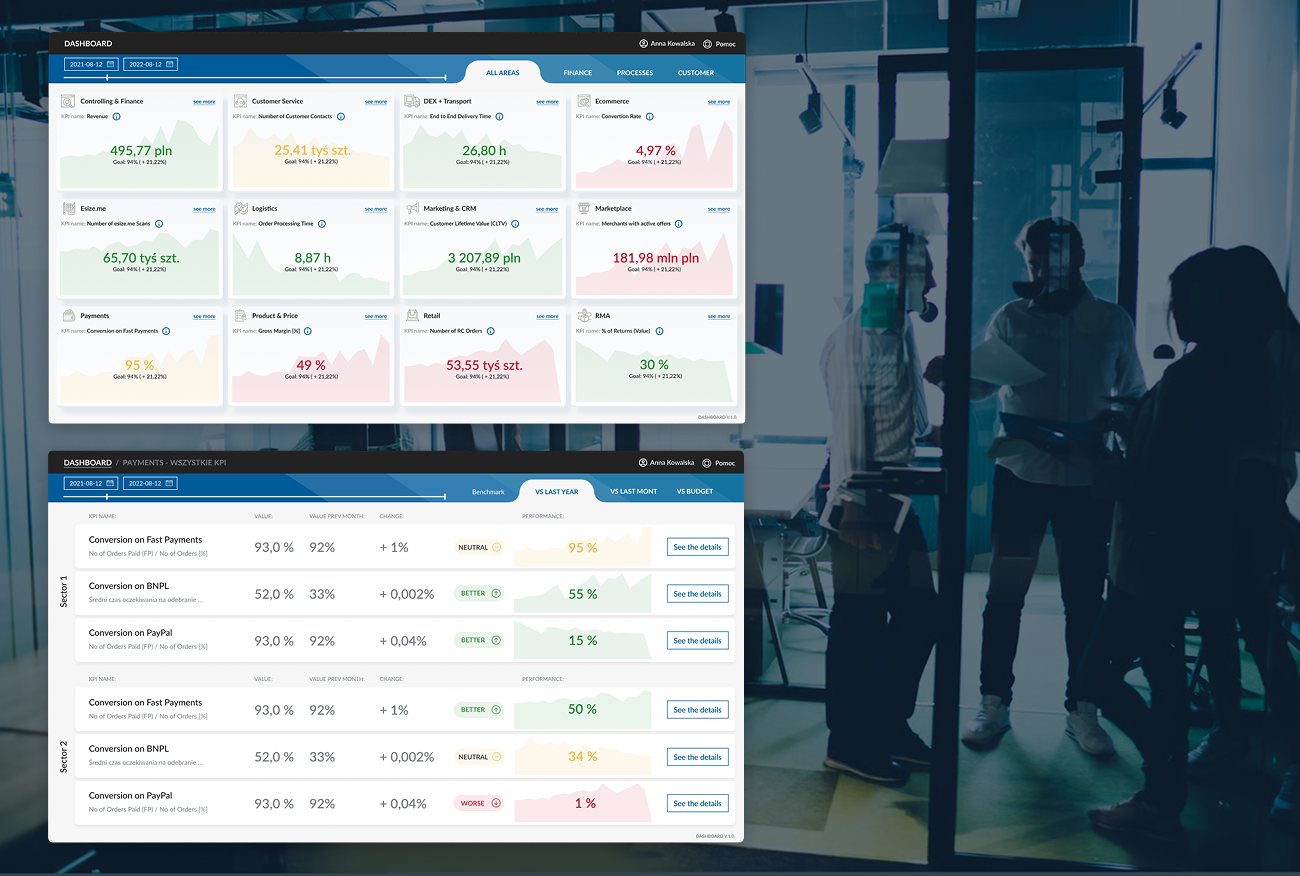
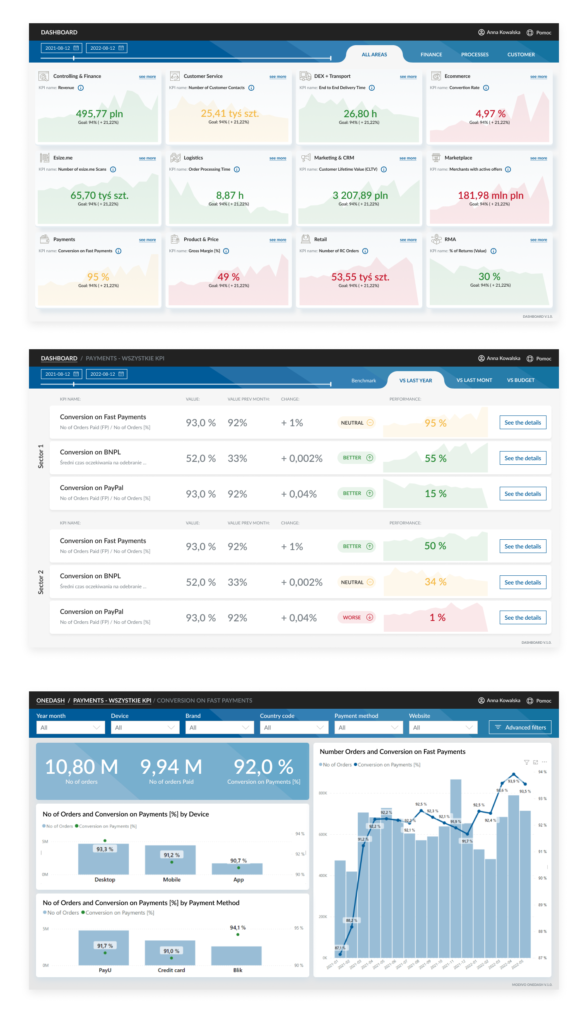
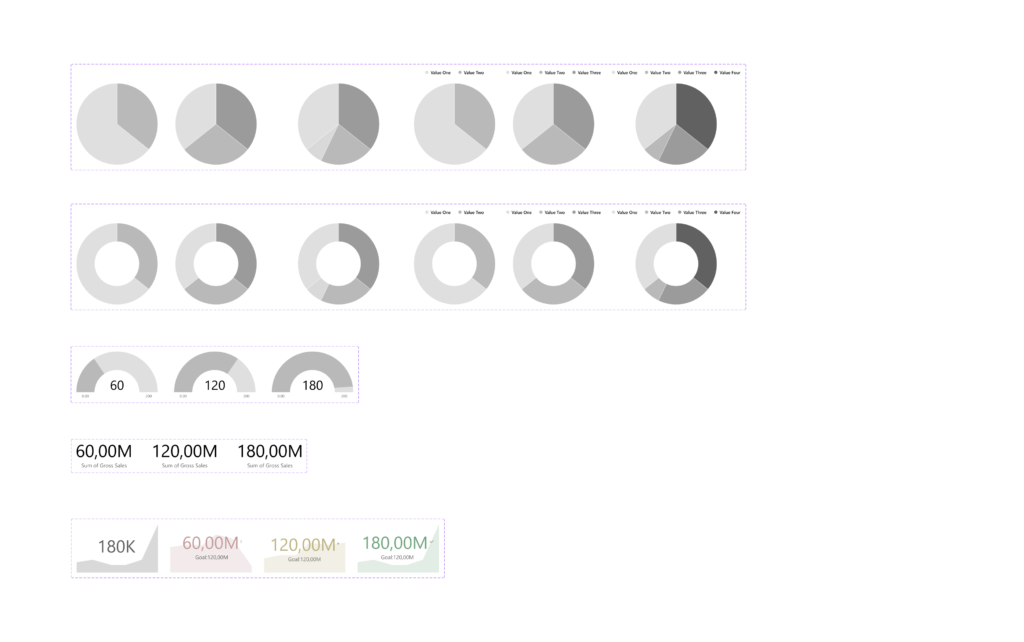
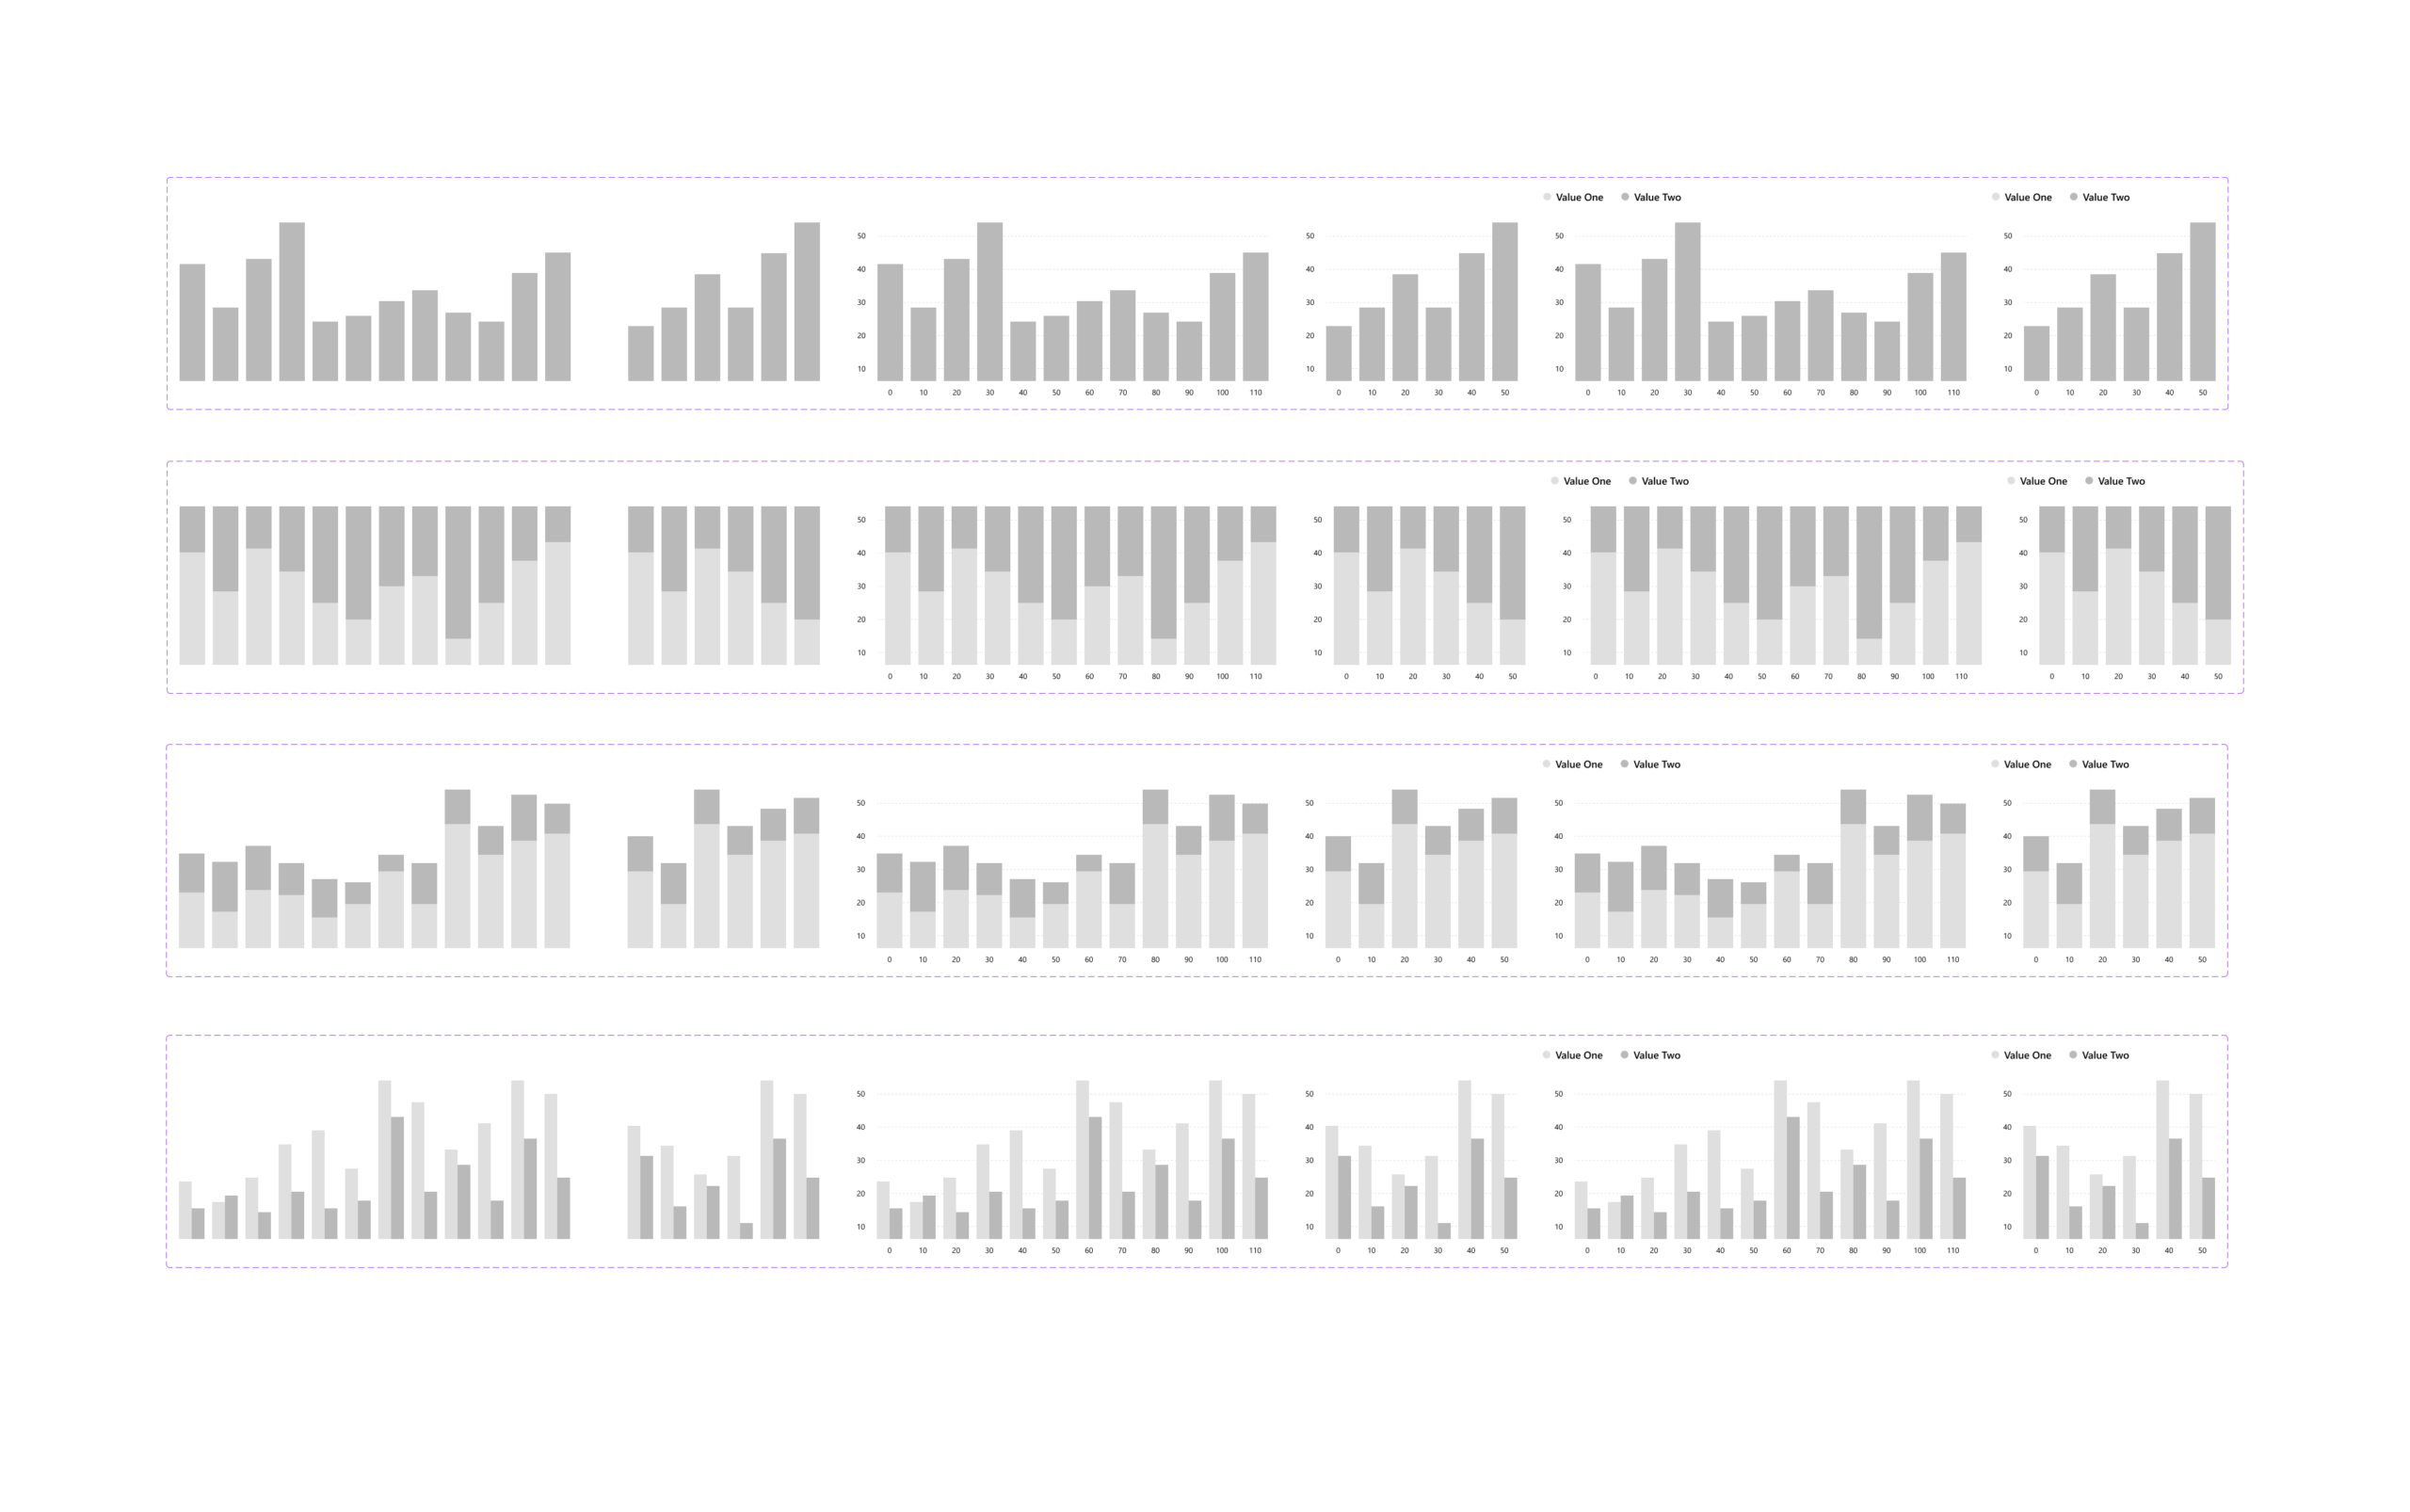
The components were fully replicated based on those available in the Power BI library, and they were fully responsive and editable. Analysts could freely modify the number of columns, elements, adjust the color scheme, and tailor the dashboard’s appearance to the client’s visual identity. The solution also included a series of workshops on basic Figma usage, enabling them to independently create a professional design.

/ Challenges

The challenge was accurately replicating the complex Power BI elements, which included many different alternative versions and could be presented in various layout configurations. Additionally, in-depth interviews with analysts had to be conducted to understand their needs and the real scenarios in which they might use this tool.

/ Objectives

  • Design of reusable components replicated from the original Power BI elements.
  • Maintaining proper proportions and components such as legends, X and Y axes, number of columns, etc.
  • Ensuring full responsiveness and flexibility of the components.
  • Preparing grids.
  • Creating ready-to-use layout configurations.
  • Enabling color scheme modifications for charts and data editing.
  • Workshops with analysts on Figma usage and the prepared components.

/ Final Outcome

The tool was adapted and used by analysts during client workshops. It significantly accelerated the visualization of ideas and potential solutions tailored to the client’s needs.